Ask for a GPU slice and queue in minutes
For a while I assumed my jobs sat in the queue because GPUs on the national clusters are scarce and there is nothing to be done about that. Half of it was true. The other half was that I was asking for a whole A100 to run something that used a fraction of one, and the scheduler was quite reasonably making me wait my turn for hardware I was then going to leave mostly idle.
The work was a batch of independent simulation tasks submitted as a SLURM job array on Narval, on a default allocation rather than a Resource Allocation Competition award, so every task went into the public queue behind everyone else's. Waits were long enough to shape the working week: submit in the evening, look again in the morning, adjust, resubmit, lose another day.
What changed was not the code. It was the size of the request.
How do I check whether my job needs the whole GPU?
Start with the jobs you have already run. On any Alliance cluster, seff gives you a summary for a finished job.
seff <jobid>
It reports CPU efficiency and memory efficiency, the peak resident memory against what you asked for. Both are useful, and neither tells you anything about the GPU. That is the gap that let me carry on believing my jobs needed the card they were getting.
For the GPU you have to sample it while the job is running. Put a line like this near the top of the job script, before the work starts:
nvidia-smi --query-gpu=utilization.gpu,memory.used --format=csv -l 60 > gpu_usage.csv &
That writes one row a minute, in the background, for as long as the job lasts, and it costs nothing worth measuring. Afterwards, read the peak. If the highest GPU memory figure across the whole run is a small share of the card's capacity, and the utilisation column spends most of its time well under full, you have your answer.
The cluster's own usage portal shows the same thing without touching your script. Narval has Metrix, Nibi has portal.nibi.sharcnet.ca, Trillium has my.scinet.utoronto.ca, and each plots GPU use per job. That is where I first saw it: a run of tasks, each handed a full A100, each using a fraction of it.
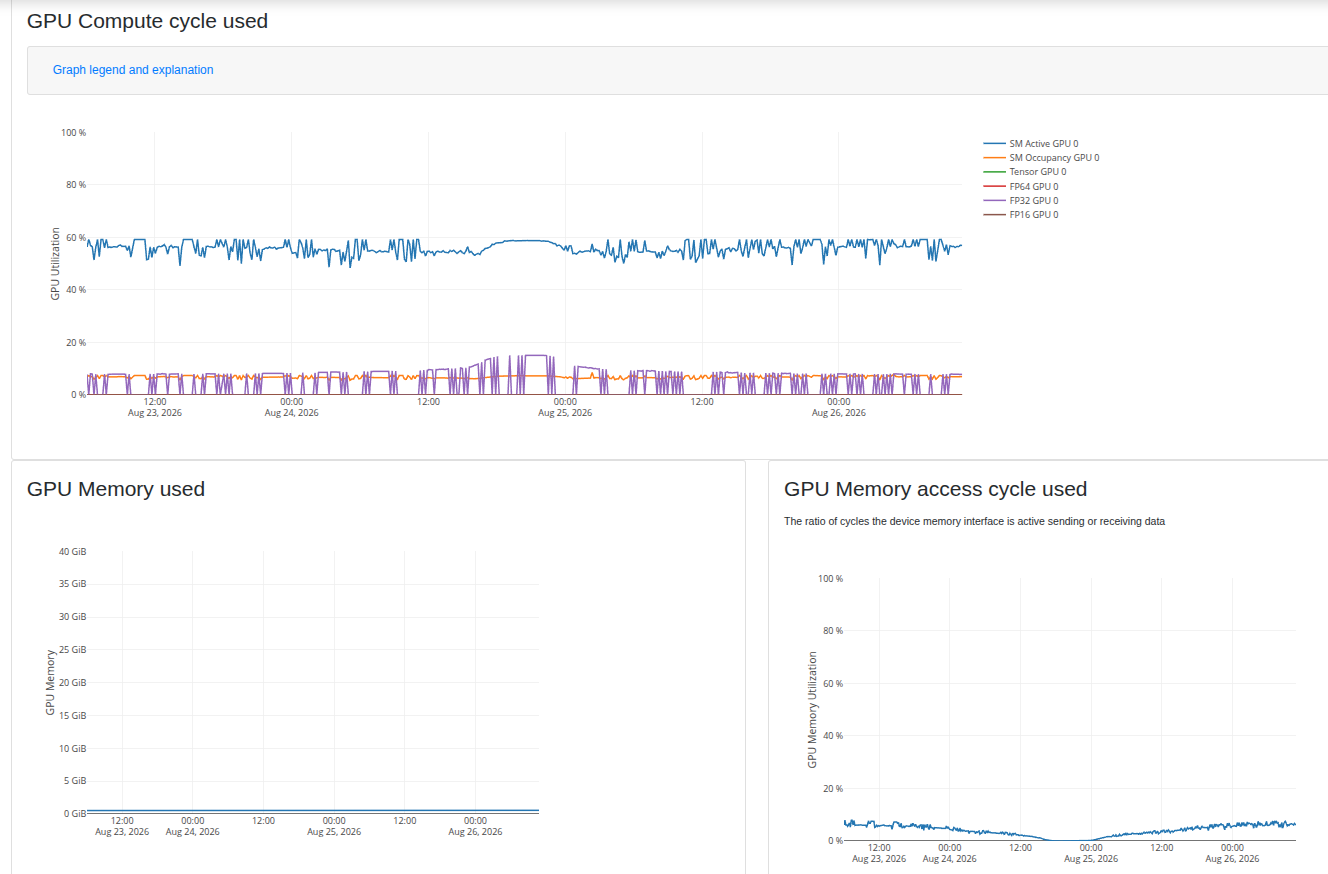
One task on a whole A100, as the portal saw it. The compute line hovers around half; the memory line barely leaves the axis.
What is a MIG slice?
MIG is NVIDIA's way of cutting one data centre GPU into several smaller, independent GPUs, each with its own memory and its own share of the compute (NVIDIA's MIG user guide). A slice is not time-sharing and it is not a queue behind someone else's work. Your task gets a real, isolated piece of hardware, just a smaller one than the whole card.
From the scheduler's point of view a slice is a different resource with a different name, and on the Alliance clusters the names differ per cluster. The Alliance wiki documents them per site; here is the shape of it as of today.
| Cluster | GPUs | Slice request | Whole GPU request |
|---|---|---|---|
| Narval | A100 40 GB | --gres=gpu:a100_3g.20gb:1 or a100_4g.20gb |
--gres=gpu:a100:1 |
| Fir | H100 80 GB | --gpus=nvidia_h100_80gb_hbm3_1g.10gb:1 (also 2g.20gb, 3g.40gb) |
--gpus=h100:1 |
| Nibi | H100 80 GB | --gpus=h100_1g.10gb:1, h100_2g.20gb:1, h100_3g.40gb:1 |
--gpus=h100:1 |
| Rorqual | H100 80 GB | same as Nibi | --gpus=h100:1 |
| Trillium | H100 80 GB | none, Trillium has no MIG | --gpus-per-node=1 (or 4 for a whole node) |
Read the fragment names as what they give you. 3g.40gb is three of the card's seven compute units and 40 GB of memory; 1g.10gb is one unit and 10 GB. Pick the smallest one your measured peak fits inside, with room to spare.
While you are editing the directives, cut the CPU cores and the memory too. Each cluster's wiki page lists the recommended maximum cores and host memory per slice, and those numbers are much lower than the whole node's. Asking for a small slice of GPU alongside a whole node's worth of RAM gets you queued as though you wanted the node.
Why a slice queues faster
Two things are happening. The obvious one is that a smaller request fits into gaps a larger one cannot. The less obvious one matters more: on Fir, Nibi and Rorqual roughly half the H100 nodes are configured as MIG nodes, so a slice request is aimed at a different pool of machines than a whole-GPU request. You are not asking for a smaller share of the same contended thing. You are queueing somewhere else.
For me the result was jobs starting in minutes rather than hours, with nothing in the simulation code touched. The other half of it is that the hardware I was given was actually being used, which is the part I should probably have cared about first.
When a slice is the wrong thing to ask for
A slice cannot talk to another GPU. There is no NVLink between slices and no multi-GPU work across them, so anything that spans devices needs whole GPUs and this whole approach is beside the point.
Trillium has no MIG at all. It schedules whole GPUs or whole nodes, with a 24 hour walltime ceiling, so the lever there is a different one.
And a slice that is too small is worse than a slower queue. Your job waits, starts, runs out of GPU memory, and dies, and you are further behind than if you had asked for the card. This is why the measurement comes first. The gain belongs to jobs that genuinely fit, and the only way to know whether yours does is to have looked at a real run.
Why is my job pending on one cluster when I have access to five?
This is the second lever, and I only learned it from a support ticket to the Alliance in the same week. Scheduling priority is accounted per cluster. Usage on one does not affect your priority on another.
A default allocation that you have worked flat on Narval is sitting completely untouched on Fir, Nibi, Rorqual and Trillium. If you have only ever used the cluster you were first shown, you are queueing against your own history on that one machine while four others treat you as though you had run nothing at all. Requesting access to the rest in CCDB takes a few minutes, and the four newer clusters have H100 nodes, which are faster than the A100s I had been waiting for anyway.
Spreading a batch across clusters is not free. Each has its own module names, its own storage layout, its own slice names as the table above shows. It is worth the afternoon it costs to get a job script working on each one, once.
Where this sits in ClusterPilot
ClusterPilot deliberately keeps resource choices in your hands. Partition selection on the submit screen is manual and always will be, because the person who knows what the job needs is you, not the tool. What the tool can do is put the information in front of you: a GPU size picker offering whole card or slice, populated from what the cluster actually reports rather than from a table in a blog post that will age, and an efficiency readout after a job finishes so the next request is informed by the last run instead of by habit. Both are on the roadmap, as issues #30 and #31 in the repo.
The thing to take away
On a shared cluster the size of your request is your queue time, and the request you type out of habit is usually bigger than the job needs. I treated the waiting as weather for months. It was a directive I had written myself and never questioned.
Ask for what the job measures, not what the card offers. Then go and get access to the other four clusters.